Beehive boasts about the attractive returns you get from investing with us, but words mean nothing without proof.
Here’s the proof:

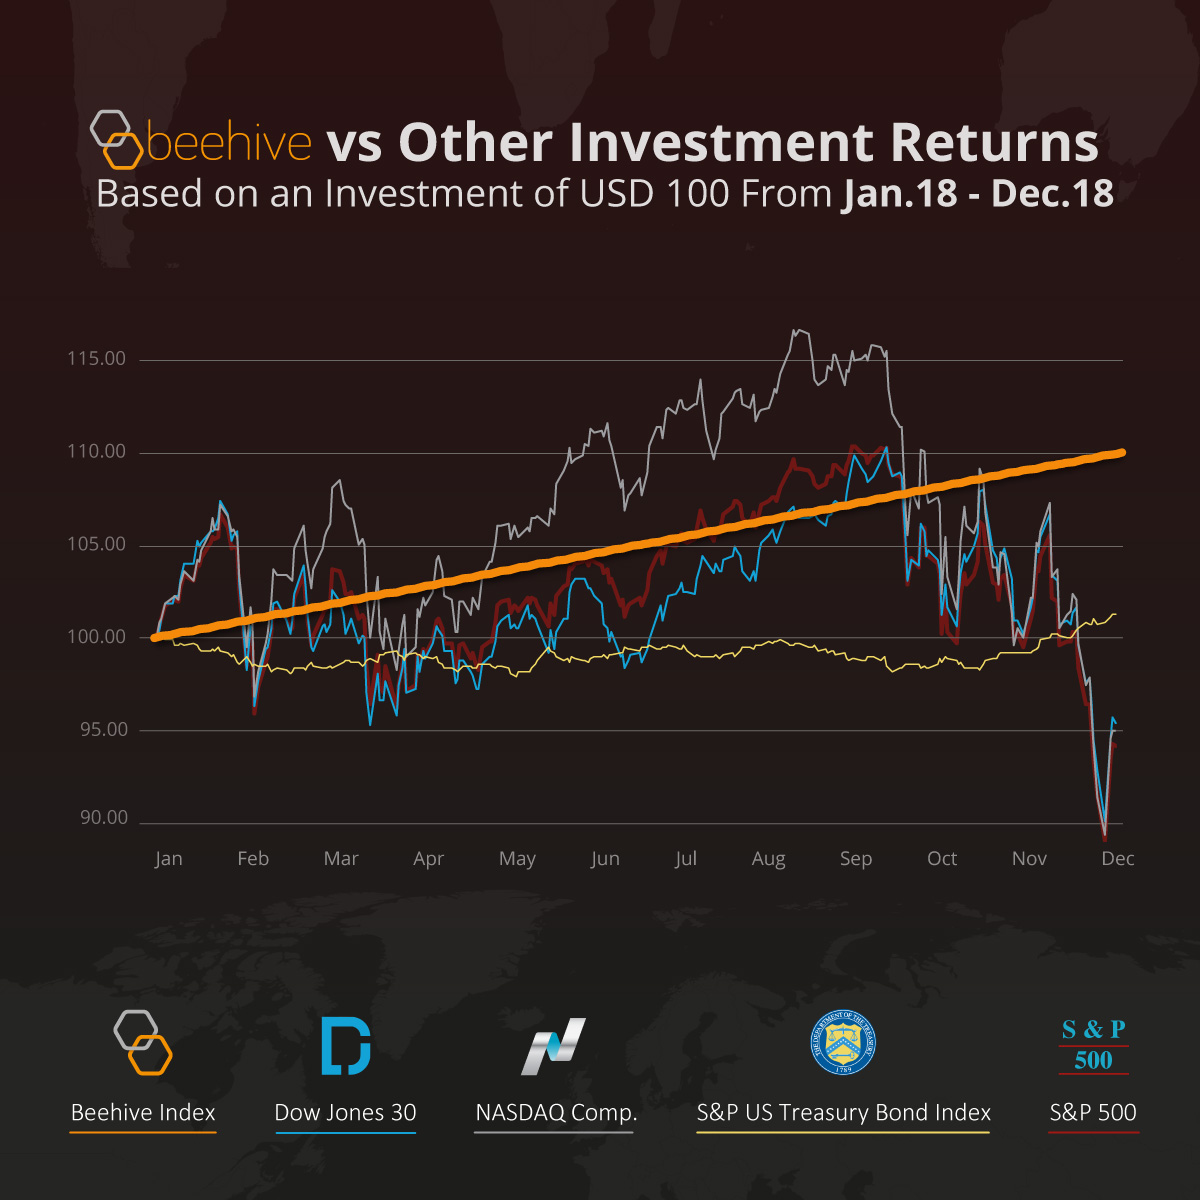
We compared returns based on an investment of USD 100 between Beehive Index, Dow Jones 30, NASDAQ Comp., S&P US Treasury Bond Index and S&P 500 from January to December 2018.
The results speak for themselves.
Beehive was the only index to consistently rise throughout the year, giving investors $110 back for every $100 they invested in January.
Beehive provides fixed rate loans to SMEs, which avoid the market volatility that equities are susceptible to. At the end of 2018 most other indexes fell in value, leaving investments worth less at the end of the year than the beginning.
If you’re interested in putting your money in an investment that has a proven track record of performing better than the top 4 global credit indexes, speak to a member of the Beehive team now.
+971 4 550 6700
[email protected]
*Source: Yahoo Finance & S&P Dow Jones Indices.
The Beehive Index is calculated based on a blended average of the actual annual return between January 01, 2018 to December 31st, 2018. It is important to note that this chart compares different investment products, each containing different levels of risk. Performance is not necessarily a reliable indicator of future performance.


